Cecily McNeill
3 November 2011
New Zealand is one of the most unequal countries in the world, says CTU economist Bill Rosenberg.
He told a Social Justice group meeting in St Joseph’s Mt Victoria in July that NZ had the fastest rising income inequality in the OECD in the 1980s and 1990s and the country is now around 10th out of 34 countries in the OECD [OECD 2010, Treasury].
The Working for Families tax credit stalled the growth in inequality in the early 2000s but, he says, inequality after housing costs have been paid is much higher even than before rents and mortgage payments have been made. ‘That shows the importance of quality, low-cost housing. Income-related rents helped, but [Ministry of Social Development figures show] inequality hardly fell in the 2000s and by 2009 it was rising again.’
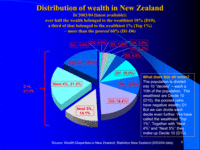 In terms of the distribution of wealth, the latest available figures from 2003/04 show that more than half the wealth belonged to the wealthiest 10 percent. ‘A third of that belonged to the wealthiest 1 percent – more than the poorest 60 percent.’
Mr Rosenberg said wealth inequalities were even more extreme than income inequalities. In 2004, the wealthiest 1 percent owned more than the least wealthy 60 percent and a 2006 survey showed that inequalities had grown. ‘It may be even more extreme than that because surveys such as the one this is based on can miss out the very few most wealthy people.’
Looking at New Zealand’s ‘Rich List’ in 2011, New Zealand Herald columnist Bryan Gaynor estimated that, ‘The top 10 in our Rich List have total assets equal to 11 percent of GDP whereas Australia’s 10 wealthiest individuals have total assets equal to just 4.1 per cent of GDP.’
Opening the economy
 The rapid opening of the economy, starting in 1984 and into the 1990s, had a part to play too. Unemployment rose steeply and didn’t get back to its previous levels for 20 years, but for Māori and Pacific peoples the rise was enormous. A big part of it was the swathes cut through manufacturing by the removal of tariffs and other protection, with the loss of many relatively well paid jobs.
Pacific Peoples’ employment (labour participation) rate has still not got back to its mid-1980s levels, and Māori employment reached its previous levels only in the early 2000s. Not only were jobs lost and people suffered long periods of unemployment, but the replacement ones they eventually found were often low paid service sector jobs.
Census results show that all real median incomes fell between 1986 and 1991 (and had not fully recovered by 1996) but Māori fared worse than the rest of New Zealand. ‘In 1996 Māori men had a median income 70.0 percent of the median income of non-Māori men, compared to 80.6 percent in 1986 … Between 1986 and 1991, the median income of Māori women fell as a proportion of the income of non-Māori women from 97.7 percent to 87.5 percent, before rising slightly in 1996 to 87.8 percent. ‘Remember this when people try to divert attention away from the effects of the “free market” with absurd statements about Māori privilege.’
Wages and salaries
Wages are the major source of income for most households. In 2010 more than half of the people over 15 were receiving wage and salary income from employment, and wages comprised over two-thirds of their average total weekly income. ‘That means getting wages right is essential to our standard of living and must play a major role in addressing the high income inequality in New Zealand.’
Global financial strife
‘Some researchers also think that the hugely increased inequality in the US and elsewhere could have been one of the underlying causes of the global financial crisis. The rapidly growing wealth of the wealthy could not be put to productive use – or could be invested at a higher rate of profit in the finance sector which loaned it out in increasingly risky loans to the millions of people trying to maintain their standards of living in the face of stagnating incomes as a result of growing inequality.
‘This led to an excessively large finance sector and loans that could not be serviced. They conclude that the only way to change things sustainably is to increase the bargaining power of employees so their incomes reflect a larger share of the economy’s production again.
‘The International Monetary Fund – before the crisis one of those urging countries to adopt policies that led to the increasing inequality and financial stability – is one source of such thinking.’
An unfair wages system
‘We are always told that wages shouldn’t rise unless productivity rises,’ Mr Rosenberg said. ‘Well, productivity rose 48 percent from 1990 to 2010, but after inflation, the average wage rose only 18 percent.’
Income shares even starker
Between 1982 and 2010 every decile lost a share of total income except the top 10 percent according to government figures.
Tax cuts and GST
Since 2008 income tax cuts in 2009 and 2010 have further increased inequalities favouring high incomes A 20 percent rise in GST from 12.5 percent to 15 percent hit lower income households harder.